
Hi!
This is the second of three articles dedicated to demonstrations I made about auditing on SQL Saturday #685 and 24 HOP Portuguese Edition last month. You can find the first post, concerning default trace here.
If for any reason (legal, business rules, etc.) you need to know who’s doing what in your SQL Server Instance or Database(s), keep on reading…
As I said in the first post, while being truly great for several troubleshooting purposes, default trace only keeps track of a relatively small subset of events (by design) and also since the size is limited to a max of 100 MB, one can’t take too long to look for the information or it might be too late…
So, how can we overcome these limitations if we need to go further, meaning being able to catch more types of events and without the size limitation of 100 MB?
Well, one way to go is using a Server Side Trace! Basically it’s SQL Trace as everyone has seen running in Profiler, where you get to choose the events you want to monitor, the information (columns) you’d like to see and the filters to help you narrow the relevant info! Yep, all this just like when using Profiler, but with a significant difference: There is no Profiler involved here, in fact, there is no client tool at all involved! The trace runs “invisibly” within SQL Server, just like a default trace, only this time you get the chance to tailor it, hence best suiting your needs! Great!
Since Profiler isn’t involved, I believe the question that arises is: “How can I build and use it?”
Server Side Trace Creation, Configuration and Running status, lies in a few system stored procedures:
- sp_trace_create: To create the trace
- sp_trace_setevent: To add the desired events
- sp_trace_setfilter: To add filters
- sp_trace_setstatus: To Start, Stop and Close the trace
Now, you can choose to do this the hard way or the easy way 🙂
In the hard way, you need to code all the above procedures (some of them many times) with the right values for their parameters according to your needs. This implies matching integer values to column names, for example, which can be rather cumbersome. Fortunately we can drastically simplify all the coding process, using a simple tool that will receive our inputs through a nice GUI and then generates all the code for us. Don’t get me wrong here, I love to code in T-SQL, but I’m sure that once you see the code generated to build the trace, you’ll find it mostly boring…
So, what is this tool that we can use to help us build the trace?… Profiler!
In order to demonstrate it, let’s create a scenario: Imagine we wanted to know what this user named: Tywin.Lannister was doing in the scope of our database: GameOfThrones…
First, we’ll create the show:
use master
CREATE LOGIN [tywin.lannister] WITH PASSWORD = 'ImetSchwarzenegger@AlongTimeAgo' --Now this is a "strong" Password :-)
GO
CREATE DATABASE GameOfThrones
GO
USE GameOfThrones
CREATE USER [tywin.lannister] FROM LOGIN [tywin.lannister]
ALTER ROLE db_owner ADD MEMBER [tywin.lannister]
GO

CREATE TABLE KingsLanding (CitizenName varchar(100), Gender varchar(1))
INSERT INTO KingsLanding VALUES
('Lord Varys', 'M'),
('Tyrion Lannister', 'M'),
('Petyr Baelish', 'M'),
('Cersei Lannister', 'F')
GO
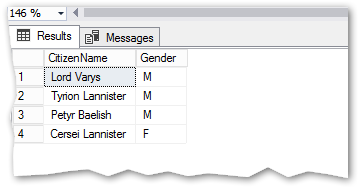
By now we have some values in our table:
SELECT CitizenName, Gender FROM KingsLanding
Let’s build the Server Side Trace:
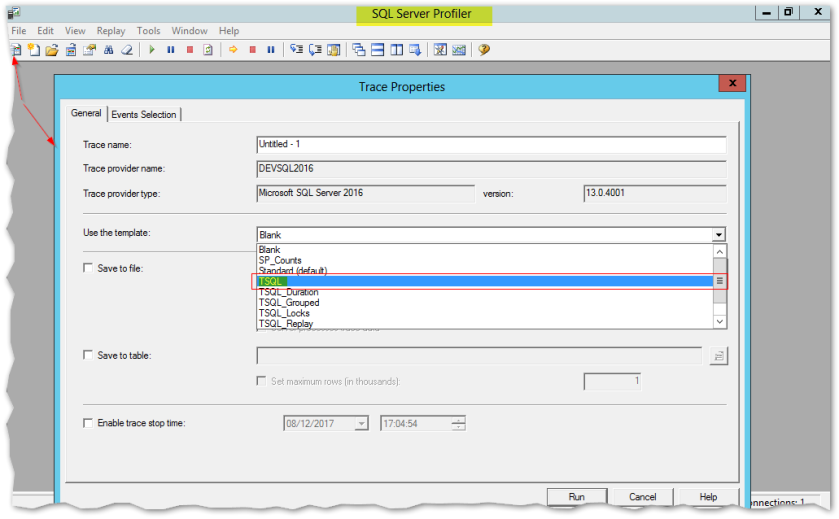
- Open SQL Server Profiler
- In the [General] tab, Create a new trace for “TSQL”
- In the [Events Selection] tab, pick “Show all columns“check box and add the following ones: ApplicationName, DatabaseName, HostName, LoginName, SessionLoginName.
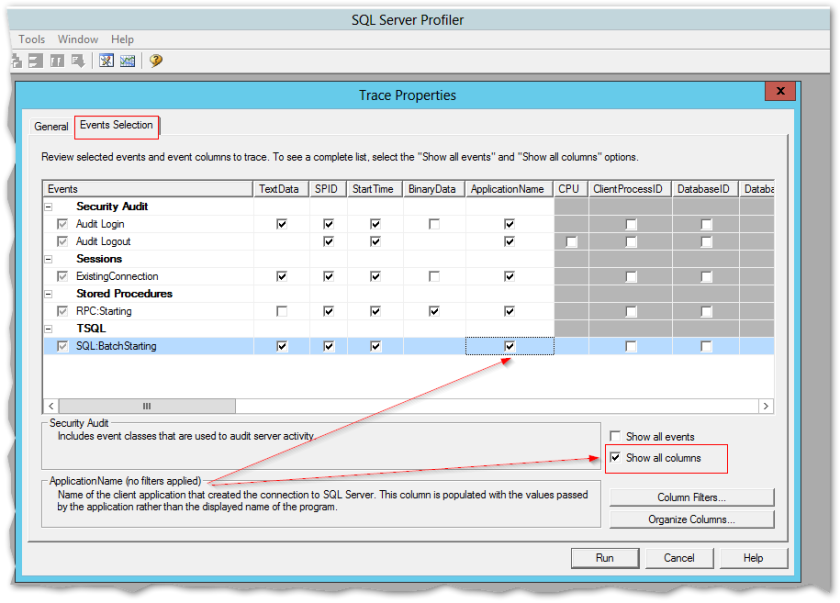 You will end up with something like this:
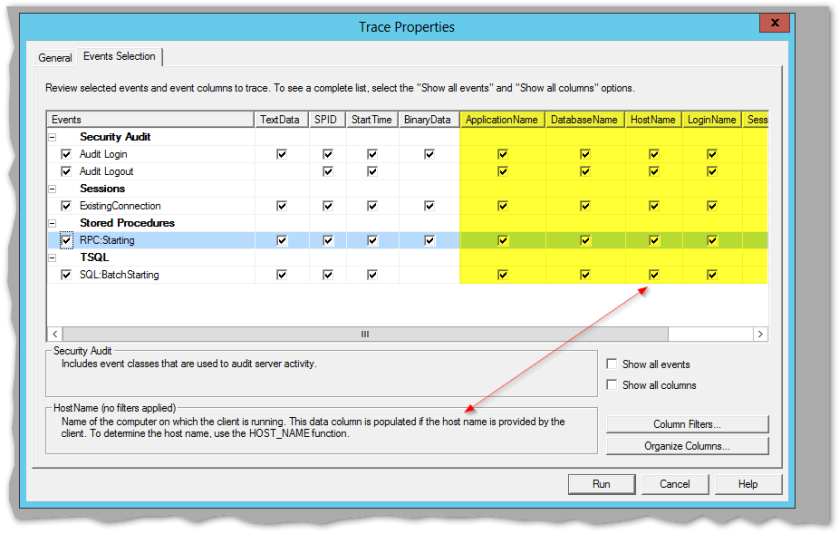 Note: You can add more columns if you need, but try not to add too many, choose carefully the ones you find most important for your auditing purposes, that is why I suggested the ones above, allowing us to know who, how and from where things come from:-)
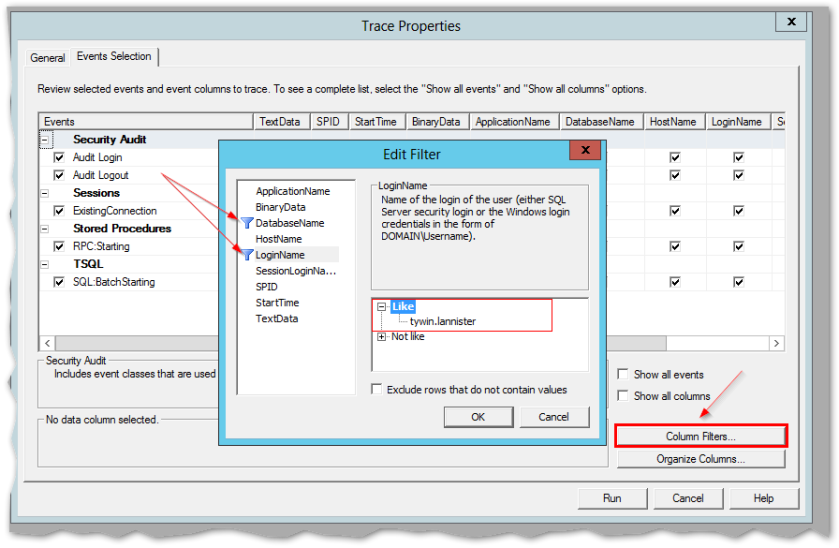
4. Last but not least the filter! This is very important, since it keeps irrelevant info from being captured, hence the trace file won’t grow so much and we’ll have less trouble maintaining the trace and finding the information we want. On the other hand, the trace will become lighter, consuming less server resources which is extremely important as well.
Back to our scenario, we’re looking for what mr. tywin.lannister is doing in GameOfThrones database, so we’ll filter by loginame and databasename (or databaseid).
To do so, in the [Events Selection] tab, click the [Column Filters] button and then choose the desired fields:
We’re ready to go, so, let’s hit the Run button.
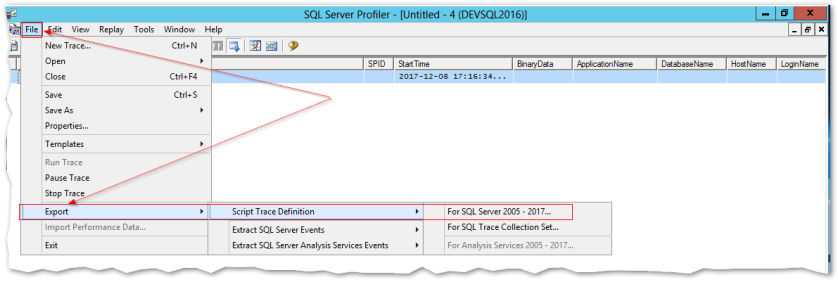
At this point you might say: “so far, all I’ve seen is a Profiler Demo!”. On a recap, all we did so far was creating our own specific trace, now that it is ready, all we have to do is get all the T-SQL code behind and it’s as easy as this:
From the [File] menu choose [Export] –> [Script trace definition] –> [For SQL Server 2005 – 2017] (depending on what version you have)
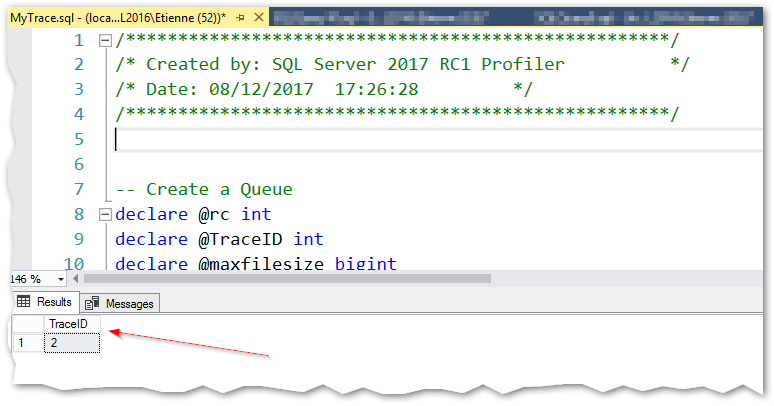
I saved the file as MyTrace.sql and to show what I mean about the easy way vs the boring way, let me show the generated T-SQL code for this trace:
/****************************************************/
/* Created by: SQL Server 2017 RC1 Profiler          */
/* Date: 08/12/2017  17:26:28         */
/****************************************************/


-- Create a Queue
declare @rc int
declare @TraceID int
declare @maxfilesize bigint
set @maxfilesize = 5

-- Please replace the text InsertFileNameHere, with an appropriate
-- filename prefixed by a path, e.g., c:\MyFolder\MyTrace. The .trc extension
-- will be appended to the filename automatically. If you are writing from
-- remote server to local drive, please use UNC path and make sure server has
-- write access to your network share

exec @rc = sp_trace_create @TraceID output, 0, N'InsertFileNameHere', @maxfilesize, NULL
if (@rc != 0) goto error

-- Client side File and Table cannot be scripted

-- Set the events
declare @on bit
set @on = 1
exec sp_trace_setevent @TraceID, 14, 1, @on
exec sp_trace_setevent @TraceID, 14, 2, @on
exec sp_trace_setevent @TraceID, 14, 10, @on
exec sp_trace_setevent @TraceID, 14, 11, @on
exec sp_trace_setevent @TraceID, 14, 8, @on
exec sp_trace_setevent @TraceID, 14, 12, @on
exec sp_trace_setevent @TraceID, 14, 14, @on
exec sp_trace_setevent @TraceID, 14, 35, @on
exec sp_trace_setevent @TraceID, 14, 64, @on
exec sp_trace_setevent @TraceID, 15, 11, @on
exec sp_trace_setevent @TraceID, 15, 8, @on
exec sp_trace_setevent @TraceID, 15, 10, @on
exec sp_trace_setevent @TraceID, 15, 12, @on
exec sp_trace_setevent @TraceID, 15, 14, @on
exec sp_trace_setevent @TraceID, 15, 35, @on
exec sp_trace_setevent @TraceID, 15, 64, @on
exec sp_trace_setevent @TraceID, 17, 1, @on
exec sp_trace_setevent @TraceID, 17, 2, @on
exec sp_trace_setevent @TraceID, 17, 10, @on
exec sp_trace_setevent @TraceID, 17, 11, @on
exec sp_trace_setevent @TraceID, 17, 8, @on
exec sp_trace_setevent @TraceID, 17, 12, @on
exec sp_trace_setevent @TraceID, 17, 14, @on
exec sp_trace_setevent @TraceID, 17, 35, @on
exec sp_trace_setevent @TraceID, 17, 64, @on
exec sp_trace_setevent @TraceID, 11, 1, @on
exec sp_trace_setevent @TraceID, 11, 2, @on
exec sp_trace_setevent @TraceID, 11, 10, @on
exec sp_trace_setevent @TraceID, 11, 8, @on
exec sp_trace_setevent @TraceID, 11, 11, @on
exec sp_trace_setevent @TraceID, 11, 12, @on
exec sp_trace_setevent @TraceID, 11, 14, @on
exec sp_trace_setevent @TraceID, 11, 35, @on
exec sp_trace_setevent @TraceID, 11, 64, @on
exec sp_trace_setevent @TraceID, 13, 1, @on
exec sp_trace_setevent @TraceID, 13, 11, @on
exec sp_trace_setevent @TraceID, 13, 8, @on
exec sp_trace_setevent @TraceID, 13, 10, @on
exec sp_trace_setevent @TraceID, 13, 12, @on
exec sp_trace_setevent @TraceID, 13, 14, @on
exec sp_trace_setevent @TraceID, 13, 35, @on
exec sp_trace_setevent @TraceID, 13, 64, @on


-- Set the Filters
declare @intfilter int
declare @bigintfilter bigint

exec sp_trace_setfilter @TraceID, 11, 0, 6, N'tywin.lannister'
exec sp_trace_setfilter @TraceID, 35, 0, 6, N'GameOfThrones'
-- Set the trace status to start
exec sp_trace_setstatus @TraceID, 1

-- display trace id for future references
select TraceID=@TraceID
goto finish

error:
select ErrorCode=@rc

finish:
go
See? 🙂
Now we’re almost finished here, but there’s just a few things we need to change:
- The trace file path (mandatory)
and optionally, although I always do it, change the maxfilesize for the trace file and choose the trace file rollover option, so that once the maxfilesize is reached, another file can be created until it reaches the maxfilesize, then another will be created and so on… This allows to have more control over the file growth, moving files to other disks if necessary, without stopping the trace and it also makes it easier to find what happened in a specific timeframe window, I mean instead of reading the entire file, if we had only one, we will just read the ones that fit in the specific timeframe window 🙂
Let me show you how to do it, by simply changing a couple of things in the script above.
Set maxfilesize for example to 20 MB instead of the 5 MB it has by default (too small in my opinion):
set @maxfilesize = 20 --Default is 5 and it is expressed in MB
Specify the trace file path and the rollover option (@options=2) in the trace creation statement. Choose an appropriate path, to a place where you have enough disk space and make sure that the user account associated with the SQL Server Service has permissions to write to it.
exec @rc = sp_trace_create @traceid = @TraceID output, @options=2, @tracefile=N'C:\Program Files\Microsoft SQL Server\MSSQL13.MSSQLSERVER\MSSQL\Log\MyTrace', @maxfilesize = @maxfilesize, @stoptime=NULL
note: if you don’t specify @options=2 in sp_trace_create, then once the maxfilesize is reached the trace stops recording to the file.
After changing this, let’s run the T-SQL Script. The result is the TraceID assigned to this trace:
Looking for the trace in our server, it is easy to find, using the sys.traces view:
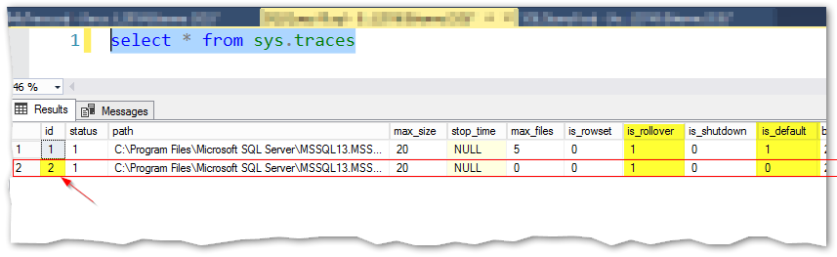
The first one corresponds to the default trace (see is_default column) and the second one is the recently created, prepared to get the info we need, right? Let’s make a test!
Let’s login as tywin.lannister and do something in the audited database:
DELETE FROM KingsLanding WHERE CitizenName = 'Tyrion Lannister'
Since he was nervous, he did it a lot of times!!
And now, the moment we’ve all been waiting for, let’s get this info from the trace:
SELECT TextData, HostName, ApplicationName, LoginName, StartTime, DatabaseName, SessionLoginName
FROM sys.fn_trace_gettable('C:\Program Files\Microsoft SQL Server\MSSQL13.MSSQLSERVER\MSSQL\Log\MyTrace.trc', null)
WHERE TextData like 'delete%'
And the results are:
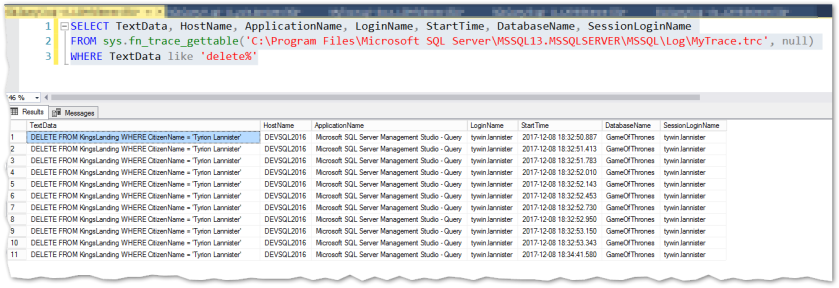
Aha, Busted!
Finally, let me show you how to control the running status of the trace, i.e. how to stop it and ultimately how to close it, when/if you don’t need it anymore:
--Stop the Trace:
exec sp_trace_setstatus 2, 0

SELECT status, event_count, last_event_time, * FROM sys.traces

--Close the trace:
exec sp_trace_setstatus 2, 2 --Close trace
Final thoughts:
- Bear in mind that a SQL Server Restart also closes the trace! This means that you’ll have to recreate it after each restart, if you still need it. Of course this can be easily achieved using a Job in SQL Server Agent with the appropriate logic built in T-SQL to recreate the trace.
- Although it can be used for auditing purposes, the essence of SQL Trace is not to keep auditing “forever”, it’s more suited to run in specific timeframes for particular reasons, usually related with troubleshooting. So if using it for auditing purposes, don’t forget to verify important things like adding just the needed columns, filtering to narrow the results, check available disk space on a regular basis and monitor resource consumption.
That’s all for today, I hope you liked it and if so, stay tuned for the next post where I’ll demonstrate the creation and use of Database Audit Specifications.
See ya!
